Top 20 Companies by Market Cap
| Rank | Company | Sector | Country | Market Cap ($B) |
|---|---|---|---|---|
| 1 | NVIDIA | Information Technology | USA | 4531.95 |
| 2 | Apple | Information Technology | USA | 4017.1 |
| 3 | Alphabet | Communication Services | USA | 3781.3 |
| 4 | Microsoft | Information Technology | USA | 3594.45 |
| 5 | Amazon | Consumer Dicretionary | USA | 2467.52 |
| 6 | Meta | Communication Services | USA | 1663.78 |
| 7 | Broadcom | Information Technology | USA | 1640.95 |
| 8 | Taiwan Semiconductor Manufacturing | Information Technology | Taiwan | 1575.93 |
| 9 | Saudi Arabian Oil | Energy | Saudi Arabia | 1561 |
| 10 | Tesla | Consumer Discretionary | USA | 1495.69 |
| 11 | Berkshire Hathaway | Financials | USA | 1084.82 |
| 12 | Eli Lilly & Co. | Healthcare | USA | 1015.99 |
| 13 | Walmart | Consumer Staples | USA | 887.96 |
| 14 | JPMorgan Chase & Co. | Financials | USA | 877.17 |
| 15 | Visa | Financials | USA | 670.64 |
| 16 | Oracle | Information Technology | USA | 560 |
| 17 | Mastercard | Financials | USA | 512.65 |
| 18 | Exxon Mobil | Energy | USA | 507.49 |
| 19 | Johnson & Johnson | Healthcare | USA | 498.6 |
| 20 | Netflix | Communication Services | USA | 428.44 |
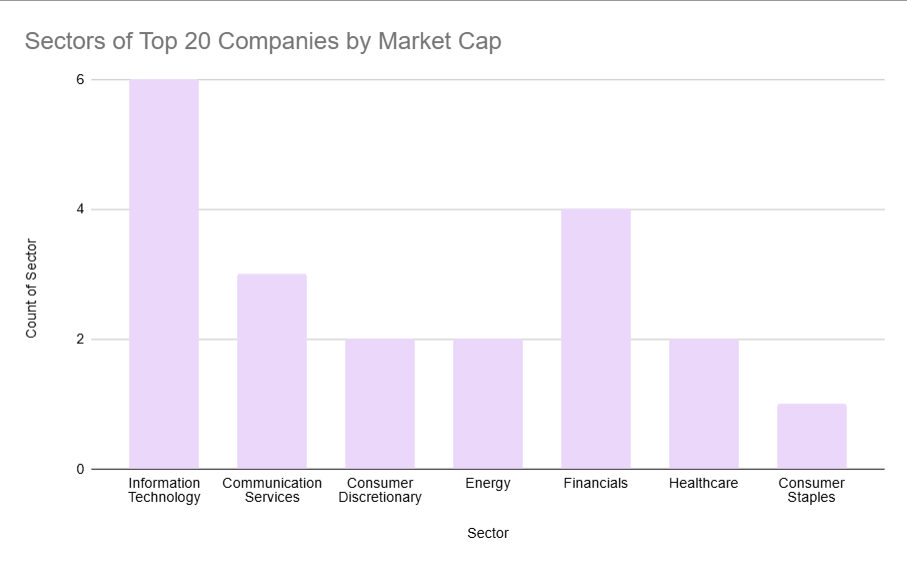
This bar chart emphasizes which sectors are more prominent within the top 20 companies ranked by market cap. A viewer would understand that information technology is a leading sector for the largest companies in the world. It isn't ordered by highest to lowest counts, but the y-axis being numbered by 2's emphasizes the differences between the sectors.
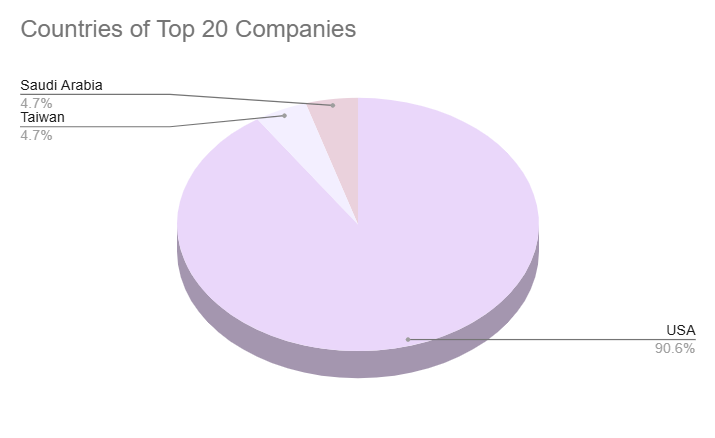
This pie chart emphasizes the leading country within the global market cap. We can see that the top 20 companies are mostly US-based with some being from Saudi Arabia and Taiwan. This would be a good model to show how US is a leading country.
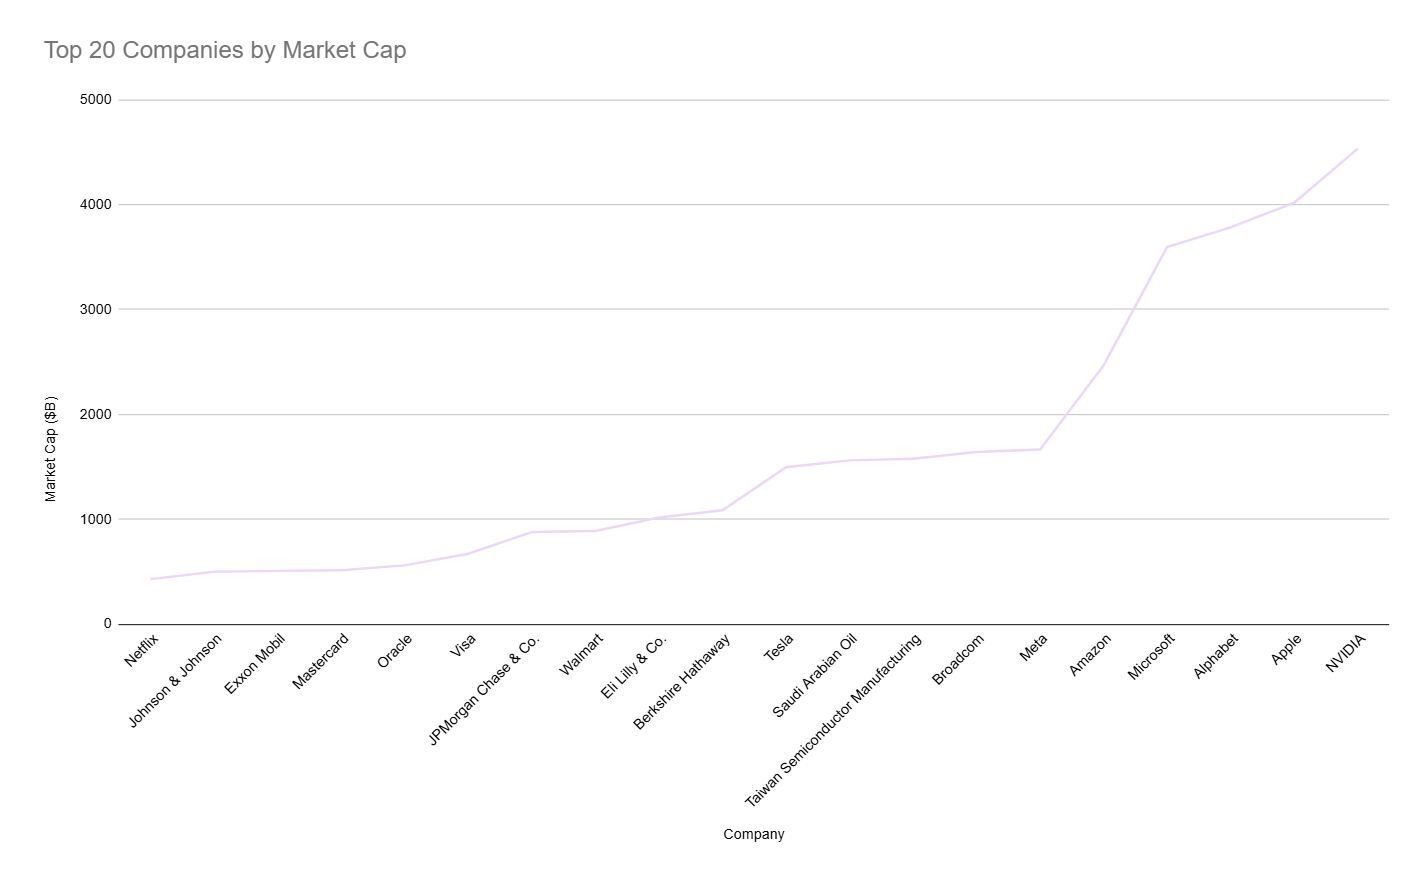
This line graph ranks the companies where it is ordered from lowest to highest market cap. Viewers can see that NVIDIA has the highest market cap while Netflix has the lowest market cap within the top 20.